Report view
Introduction
The Report view is a panel that shows text messages from LabRPS processes and tools. It is available in the menu View → Panels → Report view.
Certain properties of this panel, like color of the text and whether to display it automatically on warnings or errors, can be configured in the General → Report view tab of the Preferences Editor.
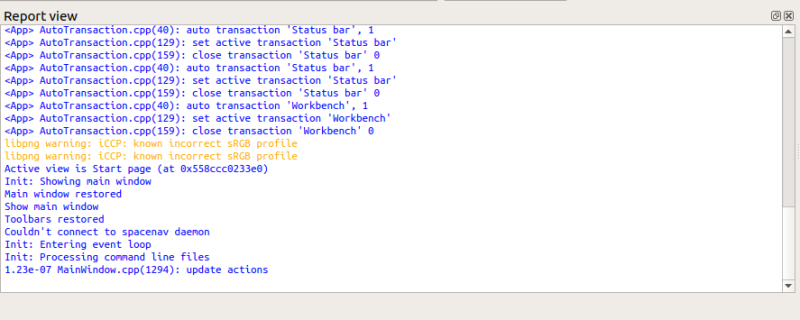
The report view showing messages when LabRPS has just started.
Messages
See also: LabRPS Scripting Basics.
The report view displays messages from the internal LabRPS Console class.
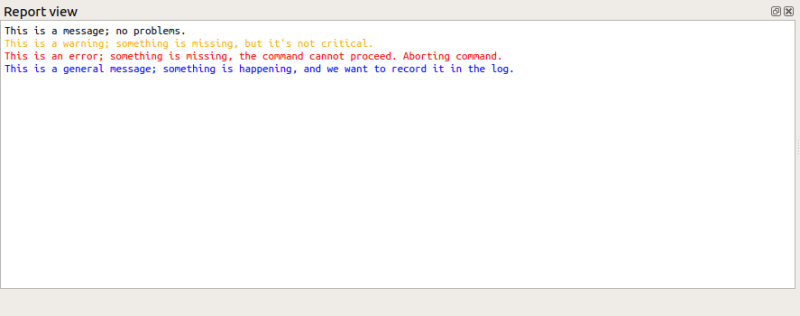
LabRPS.Console.PrintMessage("text"), print any sort of informative message, that doesn't imply any misbehavior; for example, print the coordinates of points, the result of a distance calculation, the number of vertices in a shape, etc. By default, in black color.LabRPS.Console.PrintWarning("text"), print messages that are intended to warn the user about strange behavior in the application. Warnings should be shown when some functionality is missing but the software still works acceptably. By default, in yellow color.LabRPS.Console.PrintError("text"), print messages that are intended to be error messages, that is, when a critical component is missing that makes a certain operation fail. By default, in red color.LabRPS.Console.PrintLog("text"), print messages that are going into the logs. These messages could be anything that is valuable to troubleshoot a problem in the future by reading the logs, for example, starting or closing a workbench. By default, in blue color.
These functions can be used from the Python console directly, or from macros and custom workbenches.
Example messages in the report view: a general message, a warning, an error, and a logged message.
Actions
Right clicking the report view opens a context menu with the following commands:
- Options:
- Display message types: see Preferences Editor.
- Show output window on: idem.
- Redirect Python output: idem.
- Redirect Python errors: idem.
- Go to end: if checked the report view will scroll to the bottom when a new message is added.
- Copy: stores the selected text in the clipboard for later pasting; it is disabled if nothing is selected.
- Select all: selects all text in the report view.
- Clear: erases all messages in the report view. This is useful if you want to troubleshoot a tool that prints messages to the report view, and want to be sure there are no old messages from previous tools.
- Save As: save the messages in the report view to a text file.
- File: New document, New Table, New Matrix, New Graph, New 2D Plot, New 3D Plot, Open..., Open Recent, Close, Close All, Save, Save As..., Save a Copy..., Save All, Revert, Import..., Export..., Merge project..., Document information..., Print..., Print preview..., Export PDF...Exit
- Edit: Undo, Redo, Cut, Copy, Paste, Duplicate selection, Refresh, Select All, Delete, Preferences...
- View: Fullscreen, Workbench, Sync view, Record selection, Single document, Multi document, Collapse/Expand, Initiate dragging, Go to selection, Selection back, Selection forward, Status bar
- Tools: Edit parameters..., Export dependency graph..., Project utility..., Alphaplot, Line, Scatter, Scatter, Scatter With X Err, Scatter With Y Err, Scatter With XY Err, Line + Symbol, Special Line + Symbol, Vertical Drop Lines, Spline, Vertical Steps, Horizontal Steps, Vertical Bars, Vertical Stacked Bars, Vertical Grouped Bars ,Horizontal Bars, Horizontal Stacked Bars, Horizontal Grouped Bars, Area, Channel Fil, Pie, Half Pie, Vectors XYXY, Vectors XYAM, Statistical Graph, Box Plot, Histogram, Stacked Histogram, 3D Plot, Bar, Scatter, Layout Grids, Vertical 2 Layouts, Horizontal 2 Layouts, 4(2x2) Layouts, 3D Wire Frame, 3D Surface, 3D Wire Frame Surface, Bar, Scatter, Contour + Color Fill, Countour Lines, Gray Scale Map, 3D Wire Frame Polar, 3D Surface Polar, 3D Wire Frame Surface Polar, 3D Scatter Polar, Polar spectrogram, Graph, Add/Remove Plot xy/xy..., Add Function..., Add Error Bars..., Add/Remove Other Plots..., Add/Remove Plot y..., Add/Remove Vector Plot..., Add Axis..., Add Left Axis, Add Bottom Axis, Add Right Axis, Add Top Axis, Legend Reorder, Add Text, Add Time Stamp, Add Image, Draw Line, Draw Arrow, Draw Ellipse, Add Nested Layout, Add Layout, Add Up, Add Down, Add Left, Add Right, Remove Layout, Swap Layouts..., Graph Tolls, Disable Tools, Data Rearder, Screen Reader, Select Data Range, Move Data Points, Remove Bad Data Points..., Drag Range, Zoom Range, Rescale To Show All, Table, Set Column(s) As, X, Y, Z, X Error, Y Error, None, Fill Selection With, Row Numbers, , Random Values, Custom Random, Show Comments, Show Controls, Formula Edit Mode, Edit Column Description, Change Type & Format, Clear Table, Sort Table, Assign Formula, Recalculate, Add Column, Go To Cell, Export ASCII..., Convert To Matrix, Matrix, Hide Controls, Set Coordinates, Set Display Format, Assign Formula, Recalculate, Clear Matrix, Transpose, Mirror Horizontally, Mirror Vertically, Import Image, Go To Cell, Invert, Determinant, Convert To Table, Add text document, Group, Units Calculator,Customize..., RPS Features..., Addon manager
- Macro: Macro recording, Macros, Recent macros, Execute macro, Attach to remote debugger, Debug macro, Stop debugging, Step over, Step into, Toggle breakpoint
- Help: Help, LabRPS Website, Donate, Users documentation, Python scripting documentation, Automatic Python modules documentation, LabRPS Forum, LabRPS FAQ, Report a bug, About LabRPS, What's This
- Getting started
- Installation: Download, Windows, Linux, Mac, Additional components, AppImage
- Basics: About LabRPS, Interface, RPS Objects, Object name, Preferences, Workbenches, Document structure, Properties, Help LabRPS, Donate
- Help: Tutorials, Video tutorials
- Workbenches: Std Base, WindLab, SeismicLab, SeaLab, UserLab, Spreadsheet, Plot, Web
- Hubs: User hub, Power users hub, Developer hub

