Interface
Introduction
The LabRPS interface is based on Qt, a well known graphical user interface (GUI) toolkit, particularly used in Linux, but also available in Windows and MacOS.
Standard interface in v0.1
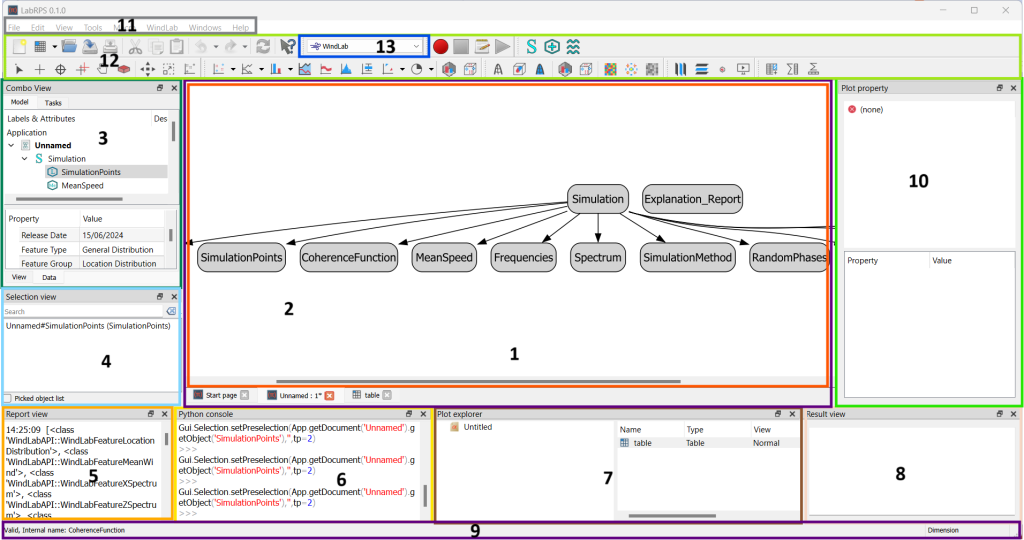
The main window of the application can be roughly divided into 13 sections:
- The main view area, which can contain different tabbed windows
- The Dependency graph view, normally embedded in the main view area
- The upper part of the combo view, which includes the tree view and task panel
- The lower part of the combo view, which includes the property editor
- The selection view
- The report view
- The Python console
- The Result view
- The Plot editor
- The Plot explorer
- The status bar
- The toolbar area, see the following information on the toolbars
- The Workbench selector, which itself is a toolbar
- The standard menu
Components of the interface
Like many pieces of software, LabRPS includes a standard menu bar, and then a series of toolbars and panels where the user tools are found.
Menus
The standard menus are: File, Edit, View, Tools, Macro, Windows, Help.
Toolbars
The standard toolbars that appear in the interface are:
- File toolbar: tools to work with files, open documents, copy, paste, undo and redo actions.
- Workbench toolbar: it contains a single widget to select the active workbench.
- Macro toolbar: tools to record, edit, and execute macros.
- View toolbar: tools to control how objects appear.
- Structure toolbar: tools to organize objects in the document, and create links to additional documents.
These can be turned on and off by right clicking on an empty space on one of the toolbars and choosing the desired element, or from the menu, View → Toolbars.
Panels
The main panels that allow working with objects are:
- Combo view: the panel that contains the tree view, the task panel, and the property editor.
- Tree view: the element that shows all objects in the document and their parametric history.
- Task panel: the panel that shows different actions and options depending on the drawing tool selected.
- Property editor: the place where object properties are modified.
- Selection view: the panel that shows elements that are currently selected.
- Report view: the text box that shows different messages from the application and its tools.
- Python console: the editor that allows running Python code interactively.
- Status bar: the bar that shows certain messages from the application, and that has the mouse navigation selector.
With the exception of the dependency graph view, all can be turned on and off by right clicking on an empty space on one of the top toolbars and choosing the desired element, or from the menu, View → Panels.
To activate and deactivate the status bar use the menu, View → Status bar.
Customization
Toolbars can have more or fewer buttons, and custom toolbars can be created with a mix of different tools, and to store developed macros.
These options are in the menu, Tools → Customize. See interface customization.
- Getting started
- Installation: Download, Windows, Linux, Mac, Additional components, AppImage
- Basics: About LabRPS, Interface, RPS Objects, Object name, Preferences, Workbenches, Document structure, Properties, Help LabRPS, Donate
- Help: Tutorials, Video tutorials
- Workbenches: Std Base, WindLab, SeismicLab, SeaLab, UserLab, Spreadsheet, Plot, Web
- Hubs: User hub, Power users hub, Developer hub
