Plugin UserLab RandomWalk
| Description |
|---|
| This plugin implements tools for the simulation of random walk. Plugin version: 1.0 Last modified: 21/12/2024 LabRPS version: All Author: Koffi Daniel |
| Author |
| Koffi Daniel |
| Download |
| None |
| Features |
| Random Walk |
| Plugin Version |
| 1.0 |
| Date last modified |
| 21/12/2024 |
| LabRPS Version(s) |
| All |
| Default shortcut |
| None |
| See also |
| None |
Introduction
A random walk is a mathematical object, known as a stochastic or random process, that describes a path that consists of a succession of random steps on some mathematical space such as the integers. An elementary example of a random walk is the random walk on the integer number line, which starts at 0 and at each step moves +1 or -1 with equal probability (Source).
QBlade Methods
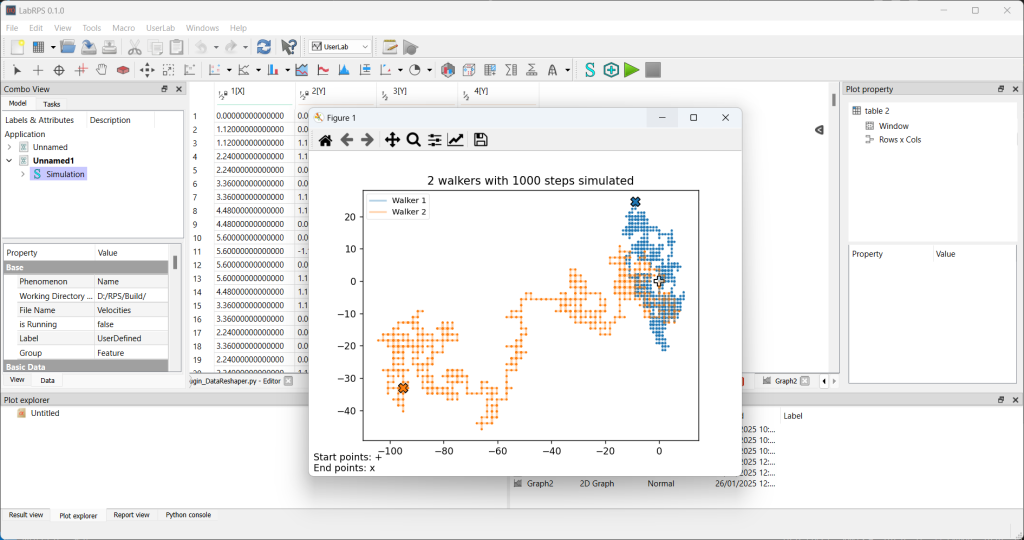
This feature aims to simulate a random walk simulation with different options and further implementations. The main implementations are:
1# Simulation of multiple random walkers with different speeds 2# High randomization of speeds, start points, colorization etc. 3# Enabling options to simulate the random walk of your needs like different neighborhood movement patterns (Neumann/Moore), enabling random start points, running the code multiple times, saving the plot and/or results automatically...
Properties
- DataTotalSteps: Number of total steps every walker shall take.
- DataNumberOfWalker: Number of total walkers to be created.
- DataMovePattern: Choose neighborhood movement pattern between Neumann (4 directions) or Moore (8 directions).
- DataRandomStart: Do you want different (random) start points for each walker or let all plots start at 0,0?.
Scripting
import numpy as np
import math
import time
import matplotlib.pyplot as plt
import LabRPS
import UserLabObjects
import UserLabGui
import UserLab
import GeneralToolsGui

# Before you run this macro, simulation must be run and there  must be a table containing the simulated wind velocities.
def simulateRandomWalk():
    #install the UserLab plugin with all its plugged features
    installResuslt = UserLab.installPlugin("RandomWalkPlugin")

    # create new document
    doc = LabRPS.newDocument()

    # create new simulation with default name "Simulation" in the above document
    sim = UserLabObjects.makeSimulation(doc)

    # check if the simulation is successfully created
    if not sim:
         LabRPS.Console.PrintError("The simulation does not exist.\n")

    # create the random walk plugin
    randomWalk = UserLabObjects.makeFeature("randomWalk", sim.Name,  "Random Walk", "Simulation Method")
    randomWalk.TotalSteps = 1000
    randomWalk.NumberOfWalker = 2

    # check if the created tool is good
    if not randomWalk:
        LabRPS.Console.PrintError("The creation of the random walk simulation method was not successuful.\n")
        return None

    # run the tool
    sim.setActiveFeature(randomWalk)
    # Run simulation and output the first(0) sample
    # store starting time
    begin = time.time()
    wlks = sim.simulate(0)
    # store end time
    end = time.time()
    LabRPS.Console.PrintMessage(f"Total runtime of the simulaltion is {end - begin} seconds\n")

    if LabRPS.GuiUp:
       import UserLabGui
       import GeneralToolsGui
       UserLabGui.setActiveSimulation(sim)
       GeneralToolsGui.GeneralToolsPyTool.showArray(1 + int(randomWalk.TotalSteps), 2*int(randomWalk.NumberOfWalker), wlks, True)
       import numpy
       arr = numpy.asarray(wlks)
       w = 0
       plot_walker_path(int(randomWalk.NumberOfWalker), arr[:,w], arr[:,w+1], 1, 1, True, w+1)
       plot_walker_path(int(randomWalk.NumberOfWalker), arr[:,w+2], arr[:,w+3], 1, 1, True, w+2)
       plot_all_walkers(int(randomWalk.TotalSteps), int(randomWalk.NumberOfWalker), False, int(sim.NumberOfSample))


def plot_walker_path(n_walkers, x, y, walker_type, walker_speed, random_start, plottedNumber):
    """Plot the coords of every step"""
    ax = plt.gca()  # get current axes
    next_col = next(ax._get_lines.prop_cycler)["color"]  # iterate through colors
    plt.plot(
        x,
        y,
        alpha=0.33,
        lw=2,
        color=next_col,
        label="Walker {}".format(plottedNumber),
    )
    plt.scatter(x, y, color=next_col, alpha=1, s=2)
    if n_walkers <= 12:
        ax.legend(fontsize="small", framealpha=0.4, markerscale=1.5)
    else:
        pass
    if random_start == "true":
        plt.scatter(
            x[0],
            y[0],
            marker="P",
            s=100,
            color=next_col,
            edgecolors="black",
        )
    else:
        plt.scatter(
            0,
            0,
            marker="P",
            s=100,
            color="white",
            edgecolors="black",
        )
    plt.scatter(
        x[-1],
        y[-1],
        marker="X",
        s=100,
        color=next_col,
        edgecolors="black",
    )


def plot_all_walkers(steps, n_walkers, want_plot_saved, run_num):
    """Generate plot with precalculated paths and show them together in a plot"""
    if n_walkers == 1:
        plt.title(
            "{} walker with {} steps simulated".format(
                n_walkers, steps
            )
        )
    else:
        plt.title(
            "{} walkers with {} steps simulated".format(
                n_walkers, steps
            )
        )
    # insert annotation with start and end point
    plt.annotate(
        "Start points: +\nEnd points: x",
        xy=(0, 0),
        xytext=(5, 5),
        xycoords="figure points",
    )

    plt.show()


simulateRandomWalk()
